
Bitcoin price is struggling to climb back above the $100,000 zone. BTC could dive if it settles below the $96,000 and $95,000 support levels.
Bitcoin Price Teeters On The Edge
In the past few days, Bitcoin price saw a fresh decline below the $109,600 level. There was a move below the $105,000 and $100,000 support levels. BTC even dipped below the $100,000 support and the 50-day simple moving average (blue).
Finally, there was a drop below the $95,000 support before the bulls appeared. A low was formed at $91,657 and the price recently started a recovery wave. There was a move above the $95,000 pivot level.
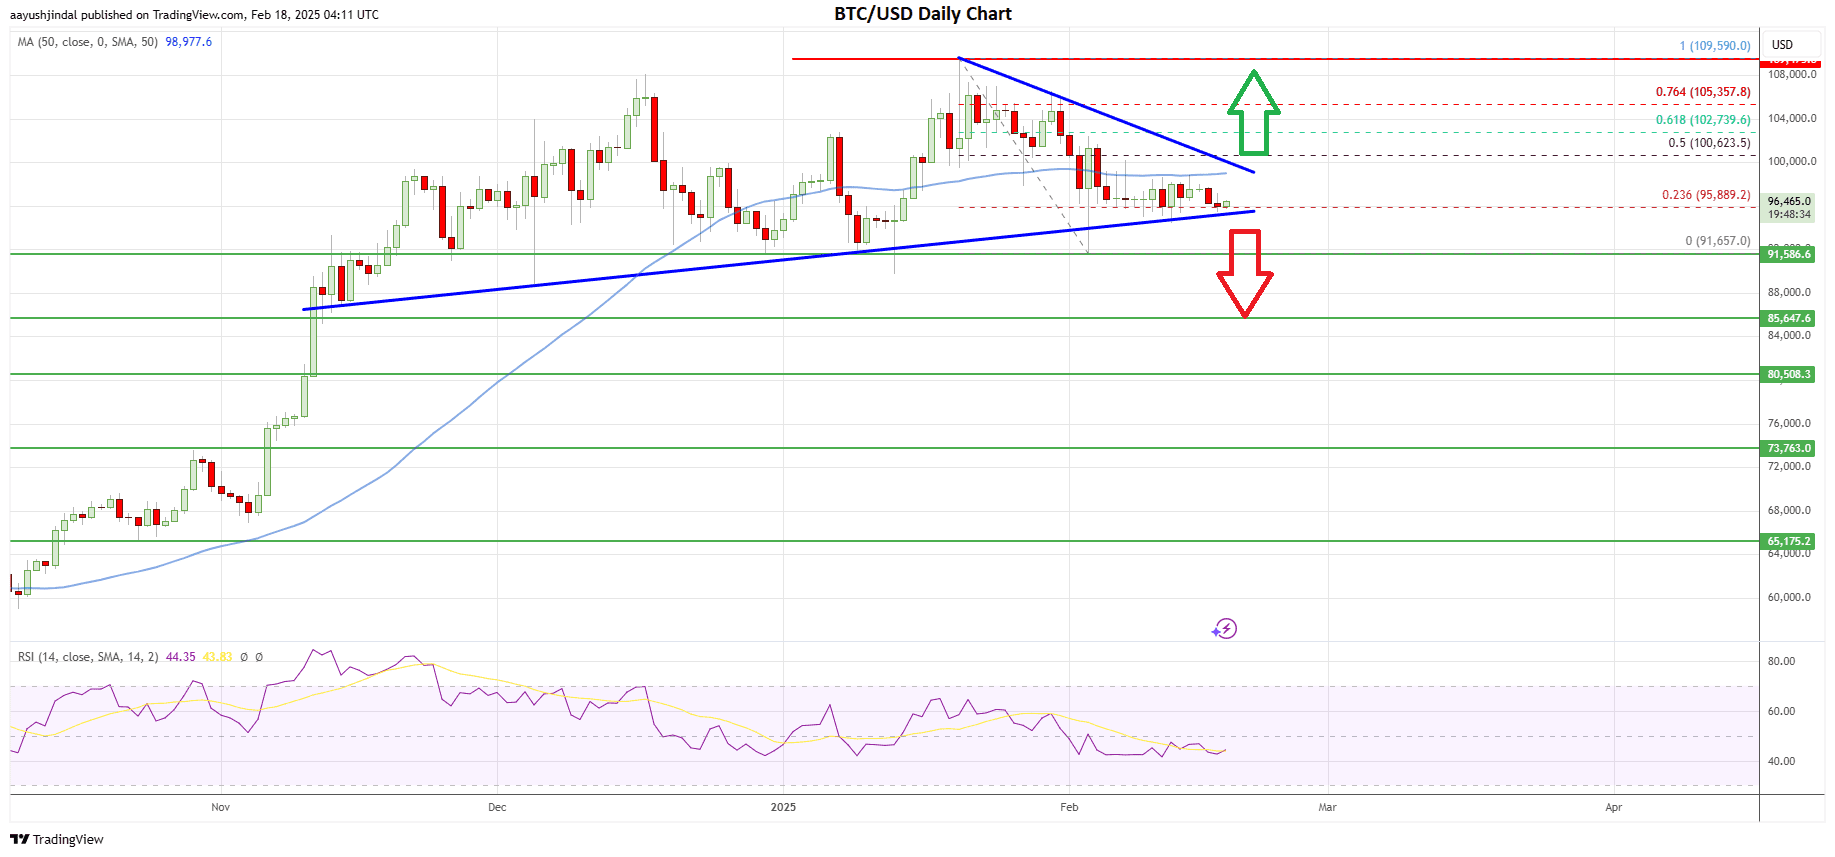
Bitcoin price daily chart | Source: BTC/USD on TradingView.comBitcoin price is now consolidating above the 23.6% Fib retracement level of the downward wave from the $109,590 swing high to the $91,657 low. However, the price is showing many bearish signs below the $100,000 zone and the 50-day simple moving average (blue).
More importantly, there is a key contracting triangle forming with resistance at $100,500 on the daily chart. The price is now testing the triangle support and struggling to stay above it. To start a fresh increase, the price must stay above the $95,000 pivot level.
On the upside, immediate resistance is near the $98,500 level and the 50-day simple moving average (blue). The first major resistance is seen near the triangle and $100,500. It is close to the 50% Fib retracement level of the downward wave from the $109,590 swing high to the $91,657 low.
A close above the triangle resistance could decrease the bearish pressure and spark some upsides. The next stop BTC price could be the $102,750 level, above which the price could attempt to clear the $105,000 level. A daily close above the $105,000 resistance zone could set the pace for a move toward the next key resistance at $110,000. Any more gains might call for a test of $113,500 or even $115,000 in the coming days.
Key Downside Break In BTC?
Conversely, Bitcoin price might struggle to clear $98,500 or $100,500 and start another decline. Immediate support on the downside is near the $96,000 level and the triangle’s trend line.
The first major support is near the $95,000 level. A downside break and close below the $95,000 support might spark more losses and the price could even dive below the $91,500 support zone. In the stated case, Bitcoin could test the $85,500 support. The next key support could be $80,000.
Overall, Bitcoin is struggling to stay above $95,000 and $96,000. To start a fresh increase, it must clear the $98,500 and $100,500 resistance levels. If not, there could be a fresh drop toward the $91,500 support zone or even $85,500.
The post Bitcoin (BTC) Hangs By A Thread—Will It Plunge or Recover? appeared first on Coinchapter.
%%featured_image%%


