
NAIROBI (CoinChapter.com)— Bitcoin is stuck between $94,000 and $100,000, with price swings failing to break the range. ETF outflows hit $580.2 million, signaling weak institutional demand, but on-chain data shows continued accumulation.
Bitcoin Price Holds in Tight Range, Traders on Edge
Bitcoin has been moving between $94,000 and $100,000 for nearly two weeks, unable to break higher or drop significantly. Price swings have been sharp, hitting $105,000 at the high and $93,000 at the low. Despite this, BTC keeps returning to where it started.
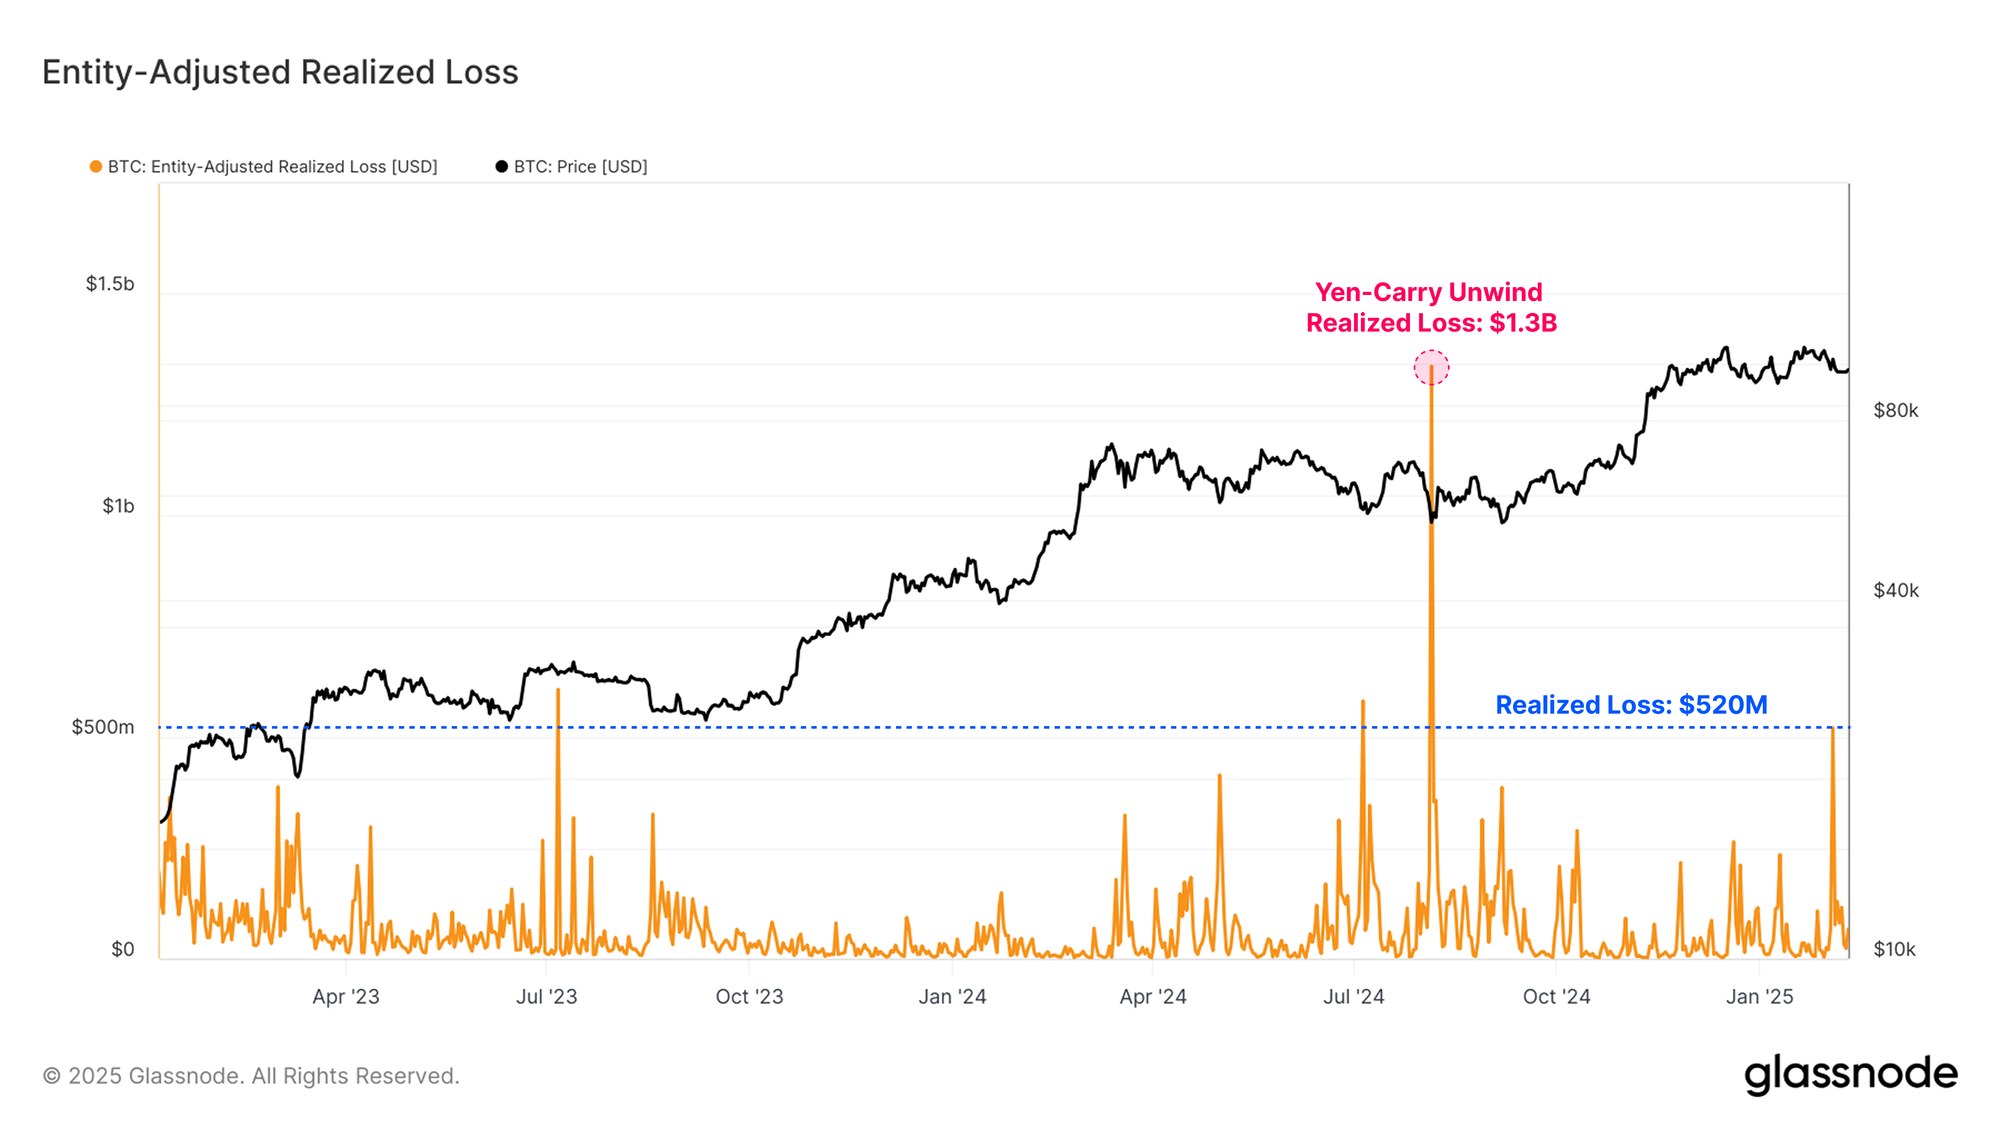
Bitcoin realized losses spike amid market turbulence. Source: GlassnodeA report from Glassnode highlights that Bitcoin’s latest volatility caused a $520 million loss, one of the biggest recent sell-offs. However, similar corrections have happened before in this cycle without derailing the uptrend.
Bitcoin: Short-term on-chain cost basis bands (Hourly) chart. Source: GlassnodeThe key level to watch is $92,200, which is the average cost basis for short-term holders. If Bitcoin drops below this level, it could open the door to further losses.
Institutional Investors Are Cashing Out
Bitcoin’s price struggles come as institutional investors appear to be stepping back. Data from Coinglass shows that Bitcoin spot ETFs recorded $580.2 million in outflows last week, compared to $203.8 million in inflows the previous week.
BTC liquidations chart. Source: CrypNuevo/XAnalysts at Hyblock highlight key levels to watch. Resistance sits between $99,600 and $99,900, while support is at $95,600 to $95,900. A drop below $94,000 could offer a buying opportunity, but losing $91,000 might send Bitcoin toward $88,000.
Despite this, CryptoQuant data shows continued accumulation. The 30DMA exchange inflow/outflow ratio has dropped below 1, meaning more Bitcoin is leaving exchanges than entering. According to Darkfost, this is typically a bullish signal, as it indicates that investors are moving BTC into long-term storage rather than selling.
Bitcoin Exchange Inflow/Outflow ratio 30DMA chart. Source: CryptoQuant/DarkForestHistorically, when Bitcoin enters a high-demand zone, it often experiences a short-term price increase. However, Darkfost cautions that some of these outflows may not reflect true accumulation but rather routine transfers by centralized exchanges to custodial wallets for ETFs, institutional holdings, or over-the-counter (OTC) transactions.
Bearish Signals Suggest Bitcoin Price Could Drop Further
The Inter-Exchange Flow Pulse (IFP) indicator, which tracks Bitcoin movements between spot and derivatives exchanges, has turned bearish, according to CryptoQuant.
Bitcoin IFP chart. Source: CryptoQuantHistorically, when Bitcoin flows into derivatives exchanges, it signals optimism, as traders are opening long positions. However, the recent trend shows Bitcoin moving back to spot exchanges, which often indicates that investors are preparing to reduce risk.
Analyst J. A. Maartunn warns that this shift could mark the beginning of a bearish phase if traders continue to close long positions and move assets back to spot markets. This pattern has previously preceded market downturns.
Regulatory Moves Could Impact Bitcoin’s Next Move
Bitcoin’s future may also depend on U.S. regulatory changes. Last week, President Trump nominated Brian Quintenz as CFTC Chairman.
Quintenz has long been a pro-crypto advocate, arguing that the U.S. should lead in blockchain innovation.
Brian Quintenz nominated as CFTC Chairman by Trump. Source: XTrump also picked Jonathan Gould, a former Bitfury executive, to lead the Office of the Comptroller of the Currency (OCC). These moves indicate that a pro-crypto stance is taking shape in U.S. financial regulation. If confirmed, they could help ease concerns for institutional investors and bring fresh demand into Bitcoin markets.
The post Bitcoin Price Stalls—Will It Crash to $90K or Break Out Above $105K? appeared first on Coinchapter.
%%featured_image%%


